Causal Inference: Interactive Study Guide
A single-page interactive web app covering causal inference from potential outcomes to Double ML, with canvas visualizations, KaTeX formulas, and a full method comparison framework.
In short: I built a one-page web app that teaches causal inference, from potential outcomes to Double ML. Sliders and clickable charts show the main ideas, and a guide helps you pick among its 9 methods.
Problem
Causal inference spans graph theory, probability, and econometrics. Lecture slides, textbooks, and static PDFs make it hard to build intuition for concepts like propensity score overlap, the algebraic equivalence of BDA and IPW, or why ML regularization bias matters for causal but not predictive modeling.
The challenge: How do you make abstract causal reasoning tangible and interactive?
Approach
I built a single-file HTML application. Its only external loads are KaTeX for math rendering and web fonts, both from the jsDelivr CDN. The study guide covers the full pipeline from fundamentals to advanced methods:
- Potential outcomes framework: counterfactuals, ATE/ATT/ATC, selection bias decomposition
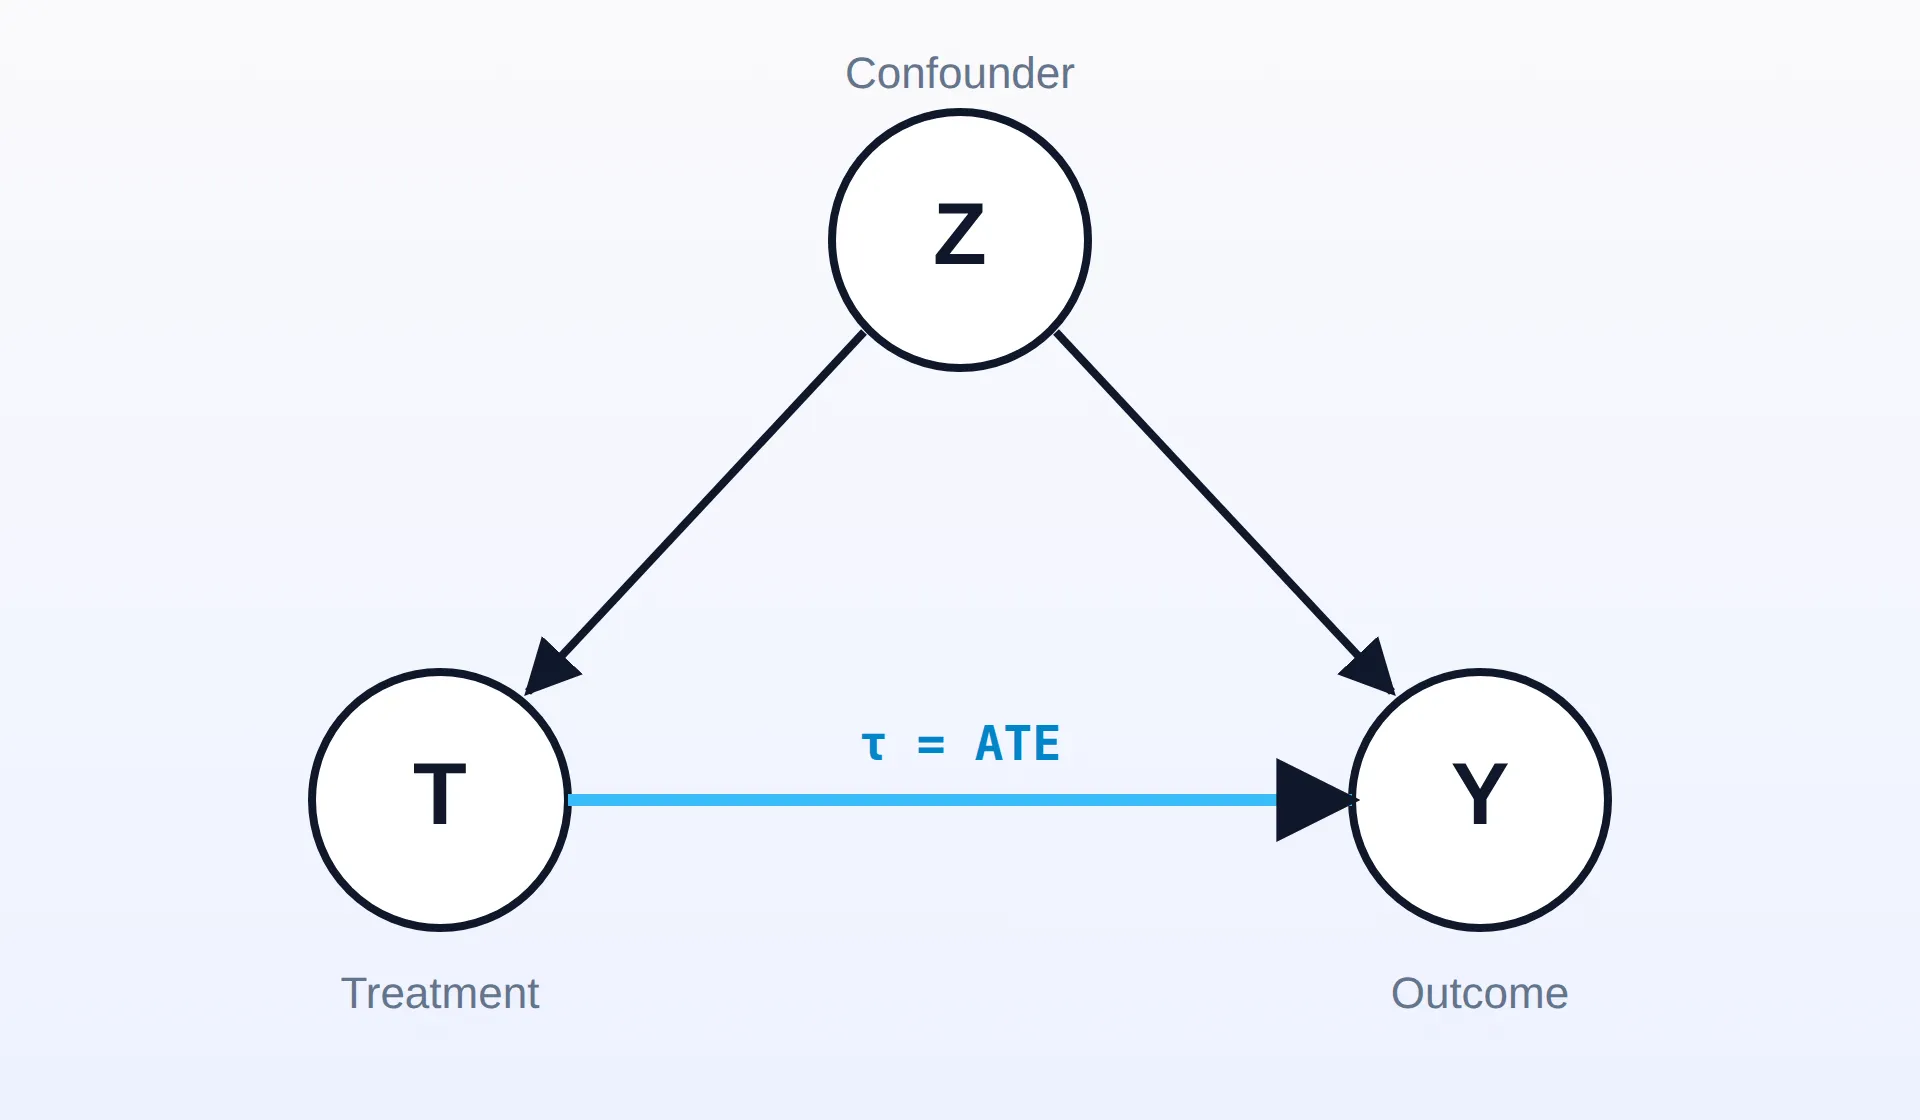
- Causal graphs: chains, forks, colliders, d-separation, back-door criterion and adjustment formula
- Matching methods: exact matching, nearest-neighbor (Mahalanobis distance), propensity score matching with calipers
- IPW: inverse propensity weighting with “surprising units” intuition
- Regression & BDA: OLS for causal inference, predict-and-average, extrapolation dangers
- Double ML: residualization, cross-fitting, R-learner for CATE
- Sensitivity analysis: breakdown point interpretation and robustness assessment
Interactive Visualizations
Canvas-based visualizations make key concepts tangible:
- Propensity score overlap: slider controls confounding strength; watch distributions separate and overlap shrink
- PS as sufficient summary: clickable propensity score bands showing diverse covariate profiles mapping to the same score
- IPW vs BDA equivalence: toggle between stratification and reweighting views of the same computation
- Breakdown point: drag confounder strength slider to see ATE shrink toward zero, with robustness gauge
Results
A single-file, browser-based study tool. Covers 9 methods with a unified decision framework for choosing between them.